HEADER

AutoAds

HealthmateForever long horizontal add 2 models 1 unit, pads, free domestic shipping, color, website

Autoads2018

Wednesday, January 31, 2018

10-POINT SOCIOECONOMIC AGENDA OF THE DUTERTE ADMINISTRATION


 1.    Continue and maintain current macroeconomic policies, including fiscal, monetary, and trade policies.
2.    Institute progressive tax reform and more effective tax collection, indexing taxes to inflation.
       A tax reform package will be submitted to Congress by September 2016.
3.    Increase competitiveness and the ease of doing business. This effort will draw upon successful models used to attract business to local cities
       (e.g., Davao) and pursue the relaxation of the Constitutional restrictions on foreign ownership, except as regards land ownership,
       in order to attract foreign direct investment.
4.    Accelerate annual infrastructure spending to account for 5% of GDP, with Public-Private Partnerships playing a key role.
5.    Promote rural and value chain development toward increasing agricultural and rural enterprise productivity and rural tourism.
6.    Ensure security of land tenure to encourage investments, and address bottlenecks in land management and titling agencies.
7.    Invest in human capital development, including health and education systems, and match skills and training to meet the demand
       of businesses and the private sector.
8.    Promote science, technology, and the creative arts to enhance innovation and creative capacity towards
       self-sustaining, inclusive development.
9.    Improve social protection programs, including the government’s Conditional Cash Transfer program, to protect the poor
       against instability and economic shocks.
10.  Strengthen implementation of the Responsible Parenthood and Reproductive Health Law to enable especially poor couples
       to make informed choices on financial and family planning.

Human development under the Duterte administration


Human resources development (HRD) is one of major initiatives of the National Competitiveness Council (NCC) for the Philippines’ global competitiveness. The seventh of the 10-point socioeconomic agenda of the Duterte Administration is about “investing in human capital development, including health and education systems, and matching skills and training.”
To create a clear understanding of the agenda, the President said in his 2017 State of the Nation Address, “Kayong mga Pilipino nakikinig sa akin ngayon. Magpa-hospital kayo, ako ang magbayad, tutal hindi man nila ako mademanda.” (To all Filipinos listening to me now. Go to hospitals, I will pay for it. Anyway, they won’t be able to sue me.)
Human development approach
President Rodrigo Roa Duterte and his socioeconomic team announced a novel approach to achieve the new Administration’s socioeconomic agenda. The “human development approach” in the delivery of education, health, and housing services is a welcome change. The emphasis will be on increasing the quality, accessibility, sustainability, and innovativeness of the socioeconomic programs, through private sector involvement. The 2017-2022 Philippine Development Plan (PDP) aims to implement government “policies, plans and programs anchored on the people’s collective vision, to uplift the living conditions of every individual, induce the expansion of the middle class, and achieve a society ‘where no one is poor.’”

President Duterte’s PDP broadens public sector involvement, as well as connection to local and global value chains. The danger is that this might lead to privatization and might not be totally accessible to the poor. The challenge is how to manage the contradictory goals and strategies.
AmBisyon Natin 2040
Socioeconomic Planning Secretary Ernesto Pernia launched in June 2017 the “AmBisyon Natin 2040”, a collection of Filipinos’ living aspirations for a better future. The vision is structured along the pillars of Malasakit (i.e., enhancing the social fabric), Pagbabago (i.e., inequality-reducing transformation), and Patuloy na Pag-unlad (i.e., increasing growth potential). These collective dreams and aspirations of the Filipino people include the following milestones: •
By 2022, the Philippines will be an upper-middle income country, with a 7 to 8 percent GDP annual growth •
Poverty rate will decline from 21.6 percent in 2015 to 14 percent by 2022 •
Unemployment rate will go down to 3-5 percent by 2022, from 5.5 percent in 2016
Other targets are higher trust in government and society, more resilient individuals and communities, and a greater drive for innovation. Specific results expected include peace and security, infrastructure development, resilient communities, ecological integrity. and
Human development index
Development is not only measured through economic gains but also through improvements in wellbeing and living conditions.
Human Development Index (HDI) is a composite statistic of life expectancy, education, and per capita income indicators. These are used to rank countries into four tiers of human development. The index was developed by Indian economist Amartya Sen and Pakistani economist Mahbub ul Haq, and published by the United Nations.
The Philippines ranks 115th out of 188 countries in the recent HDI report. In the ASEAN, we’re slightly ahead of Cambodia, Myanmar and Lao PDR, while Singapore, Brunei, Malaysia, Thailand, Indonesia and Vietnam are ahead of us in health, knowledge, and income aspects.
The socioeconomic managers need to work together to accelerate plans and strategies for Millennium Development Goals (MDG) achievement that should lead to a higher HDI. The PDP hopes to generate more revenues through macroeconomic policy reforms, such as the TRAIN (Tax Reform for Acceleration and Inclusion Act); increasing the competitiveness of industry, agriculture and fishery and service sectors; accelerating infrastructure development; fostering good governance and enforcing the rule of law; social development; and peace and security.
Budgetary support
Analysts observe that “having a vision is one thing, and providing the necessary budget towards realizing it is another.” Considering the 2017 General Appropriations Act (GAA), there seems to be a gap between the promise of social development in the PDP and what Filipinos can expect.
For education, a 6% appropriation of the country’s gross domestic product (GDP) is needed to realize the promise of free tertiary education. While a law granting full tuition subsidy for students in state universities and colleges was passed, the GAA did not fund this initiative. For public health services, Health Secretary Paulyn Ubial believes that “an additional P57 billion is needed to bring the doctor to patient ratios near the Cuban Health System or the World Health Organization (WHO) standards.” On housing, the “gold standard” target is roughly 2% to 5% of GDP in order to “close the gap of 5.5 million housing units or to build some 2,600 socialized housing units per day.”
In fairness, the 2018 education budget of P637 billion is 32% higher than this year’s and the budget of the Commission on Higher Education ( CHED) also increased by 237% to P18 billion. However, the total education budget is only 2% of GDP, and Budget Secretary Benjamin Diokno admitted that the “government cannot afford the P100 million budget for the new free college education act.”
The 2018 health budget is up by 19%, to P149 billion. However, P50 billion was allocated to expand health financing under Philhealth. The budget for service delivery networks was cut by 10 percent, and only P7 billion is allotted each for Health Human Resource Development and the Doctors to the Barrio Program, not enough to close the doctor-patient ratio gaps.
Housing budget is down by 54% to P15 billion, which will be shared by the National Housing Authority, Social Housing Finance Corporation, the National Home Mortgage Finance Corporation, and the Housing and Urban Development Coordinating Council, which is now under the Office of the Cabinet Secretary. This will not close the huge housing backlog of 5.5 million units, plus the additional 1.5 million units under the 2017 PDP.
President Duterte and his socioeconomic team have set an ambitious plan for raising the standards of human development for Filipinos. The plan is commendable, considering that the Philippines is on a catch up mode with its Asian neighbors. However, at least this year, the budget does not seem to explain howthe team will make the plan a reality, when the budget’s priorities are “peace and security, infrastructure development, and the war on drugs.”
Of course, planning is one time; implementation is another.

National Budget of 2018 reflects socio-economic agenda of President Duterte

MANILA, Dec. 22 – President Rodrigo Duterte signed into law the 2018 General Appropriations Act (GAA) on Dec. 19, 2017, culminating several months of preparation and scrutiny by the Executive and Legislative branches of the government. It can be remembered that the 2018 Proposed Budget was submitted to Congress on July 24, 2017, the day President Duterte delivered his second State of the Nation Address (SONA), before going through careful deliberations in both houses of Congress.
The 2018 GAA, otherwise known as the 2018 National Budget, articulates the development priorities of the Duterte and embodies the policies meant to promote a more secure, cohesive, and prosperous society. It strives to reward all Filipinos with a “matatag, maginhawa, at panatag na buhay." In essence, the National Budget brings flesh and bone to the President’s promise of real change. It is a budget that reforms and transforms; a budget for the people, by the people.
Expenditure Program by Sector

The enacted obligation budget for FY 2018 is set at P3.767 trillion, 12.4 percent higher than the 2017 budget and equivalent to 21.6 percent of Gross Domestic Product (GDP). It is an expansionary budget in line with the Duterte administration’s expansionary fiscal policy. Such a fiscal strategy will sustain the necessary socio-economic investments, primarily in infrastructure and human capital development.
Social services remains to be the largest sectoral allocation in the 2018 budget receiving P1.426 trillion, a 5.5 percent increase from the 2017 GAA. This is primarily driven by spending on education and healthcare as well as social security, social welfare, and employment safety nets. This is consistent with the government’s aims of developing the country’s most important resource - its people. Human capital development has been cited as a key strategy for poverty-alleviation and economic growth.
Next, economic services is granted P1.154 trillion for a 25 percent year-on-year increase. The hefty sum primarily accounts for infrastructure and agricultural development allocations. Modernizing the country’s public infrastructure has been a priority of the Duterte administration since day one, particularly evident with the government’s Build Build Build campaign. Such investments for infrastructure are seen to boost economic activity, attract investments, create jobs, and provide an affordable and comfortable public transport system for Filipinos. Meanwhile, enhancing agricultural productivity and expediting land reform will benefit the country’s rural sector, more so since the poorest of the poor reside in the countryside.
General public services is given P655.4 billion for a 13.9 percent increase. The largest allocations under this sector belong to general administration and public order and safety. Such an amount will ensure the smooth operations of government agencies, hence the more efficient and effective delivery of public services.
Meanwhile, defense is granted P161.5 billion, rounding out to an 8.6 percent increase. This allocation will primarily serve internal defense and domestic security.
To complete the sectoral picture of the 2018 budget, debt burden is given P370.8 billion for a 5.5 percent increase. Of this amount, P354 billion is set aside for debt service interest payments while net lending is granted P16.8 billion.
In sum, the social services and economic services sectors continue to receive the highest budgetary allocations accounting for 37.8 percent and 30.6 percent of the P3.767 trillion budget, respectively. On the other hand, general public services is given 17.4 percent of the budget while defense is given 4.3 percent. Lastly, debt burden accounts for 9.9 percent of the 2018 Budget.

Education, Public Works lead top ten departments
True to the Constitutional mandate to assign the highest budgetary priority to education, the Education sector accounts for P672.4 billion of the 2018 National Budget to register a 7 percent year-on-year increase. The Department of Education (DepEd), which ranks first among all departments, is allocated P553.3 billion for quality and affordable basic education. Meanwhile, State Universities and Colleges (SUCs) are given a total of P62.1 billion for the operations and improvements of public higher education institutions. The Commission on Higher Education (CHED) is also given P49.4 billion, a noticeable 164 percent increase, to finance the scholarships, grants, and subsidies for higher education. The CHED budget already includes the funding mandated by Republic Act No. 10931, or the Universal Access to Quality Tertiary Education Act. In terms of technical-vocational education, the Technical Education and Skills Development Authority (TESDA) is given P7.6 billion to train competitive and technically-proficient students who are readily employable.
Coming in second is the Department of Public Works and Highways (DPWH) with an allocation of P637.9 billion, a 40.3 percent increase from its 2017 budget. The huge funding for the public works department is a testament to the Duterte administration’s ambitious infrastructure program wherein about P1.1 trillion in the 2018 budget is earmarked for infrastructure development. The DPWH allocation will sustain the infrastructure momentum of the government by providing funds for the construction, rehabilitation, and improvement of roads, bridges, flood control systems, among other infrastructure facilities. 
In terms of infrastructure, the Department of Transportation (DOTr) is also given P66.3 billion in FY 2018 for a 24.4 percent increase. The DOTr will receive the seventh-largest allocation in terms of allocation by departments. The DOTr budget will provide for a safe, affordable, and comfortable public transportation system for all Filipinos.
At the third rank is the Department of Interior and Local Government (DILG) with appropriations amounting to P170.8 billion, representing a 15.4 percent increase. This will support the President’s thrust for public order and safety, and domestic security, while also expediting public service delivery at the local level. With regards to security, the Department of National Defense (DND) also has the fifth-largest allocation in the 2018 budget with P149.7 billion, a 9.1 percent increase. Such funding will be used to protect our territorial integrity and upgrade the military capability of the Armed Forces of the Philippines (AFP) through the AFP Modernization Program.
Moving on, the fourth-largest share of the budget is with the Department of Health (DOH), inclusive of the allocation for the Philippine Health Insurance Corporation (PHIC), with a total of P167.9 billion, or a 12.3 percent increase. At the same time, the sixth-largest allocation of the budget is with the Department of Social Welfare and Development (DSWD) with P141.8 billion for a 10.5 percent increase. The hefty funding for DOH and DSWD will promote the Duterte administration’s continued emphasis on human capital development – in essence, ensuring that our citizens, particularly the youth and the elderly, have access to adequate healthcare, education, and the requisite social protection programs.
Rounding out the top-ten departments are the Department of Agriculture (DA), the Autonomous Region in Muslim Mindanao (ARMM), and the Department of Environment and Natural Resources (DENR). This is consistent with the administration’s push for equitable development, balancing growth between the urban and rural areas, the leading and lagging regions, and economic prosperity and ecological integrity. Hence, the DA is given P53.5 billion for an 18.1 percent increase. Meanwhile, the ARMM and DENR are given P33.1 billion and P24.9 billion, respectively. For the ARMM, this is a 2.5 percent increase relative to its 2017 budget.
2018 budget stays true to the promises of President Duterte
The 2018 Budget also fulfills the President’s most sought after promises, such as free tuition, free irrigation, doubling of salaries of military and uniformed personnel, and the rehabilitation of Marawi City.
Universal Access to Tertiary Education, otherwise known as the Free Tuition Law, is given an allocation of P40-billion in the CHED budget. This will exempt all enrolled students for SY 2018-2019 from paying tuition, miscellaneous and other school fees such as registration fees, laboratory fees, among others.
Meanwhile, around P41.7 billion has been set aside for the National Irrigation Administration (NIA) for the development, construction, repair and rehabilitation of climate-resilient irrigation systems. Included in this amount is the 2-billion subsidy for Irrigation Service Fees (ISF).
What started as a campaign promise is also set to materialize with the Congressional approval of the increase in the salaries of Military and Uniformed Personnel (MUP). The increase in base pay will result in an average increase of 58.7 percent for all ranks. The P64.2 billion additional cost of the increase in base pay will be funded from the Miscellaneous Personnel Benefits Fund (MPBF) and from any available allotment in the respective budgets of the agencies concerned for FY 2018.
The 2018 budget also includes a P10-billion allocation for the Marawi Rehabilitation and Recovery Program lodged in the National Disaster Risk Reduction Management Fund (NDRRMF). This will take care of the infrastructure, housing, healthcare, education and livelihood needs of the communities affected by the war. (DBM)

Monday, January 29, 2018

The Duterte's Administration plan to pull 10 million people out of poverty


The Philippines president, Rodrigo Duterte, is trying to end poverty for up to 10 million people during his term — or 35 percent of the country’s poor.
It’s an ambitious goal for a country with a lackluster history of fighting poverty. Compared to its neighbors, the country has lagged on this front. Its neighbor to the North, China, has lifted 800 million people out of poverty since 1978, basically setting the all-time record.
Poor Filipinos have not benefited from similarly aggressive government action. Extreme poverty still afflicts 18.4 million Filipinos, and others are affected by milder versions.
A weak education system, poor infrastructure, weak jobs programs, inconsistent healthcare, corruption and other factors have all contributed to this.
Duterte says that his poverty-alleviation program will be focused in rural areas, where families have generally languished without assistance.
In the first year, the administration wants to spend $21.5 billion —a third of the country’s budget — on small to mid-range infrastructure projects like roads and schools that can be quickly built and put to use.
The schools will help to close generational cycles of poverty. Most poor families in the country are headed by people without even an elementary school education.
Numerous studies show that education greatly improves a child’s potential in life. This is especially true for girls who are most likely to be pulled from school at an early age.
Roads will allow farmers to better access markets where they can sell their goods and earn an income.
The government will also try to expand reproductive health measures to reduce the average family size, freeing up household budgets and giving women greater independence.
Duterte is fortunate that the outgoing government was able to foster strong growth in urban areas, leading to an annual economic growth rate of 6.2% over the past 6 years.
His government wants to build on these accomplishments by better spreading the prosperity.
Right now, this is all just rhetoric. Duterte has already been criticized for his bluster and who knows if these plans will be fully and equitably carried out.
A lot has to go right for millions to be alleviated of poverty. But any ambitious policy has to start somewhere.

    Poverty In the Philippine History


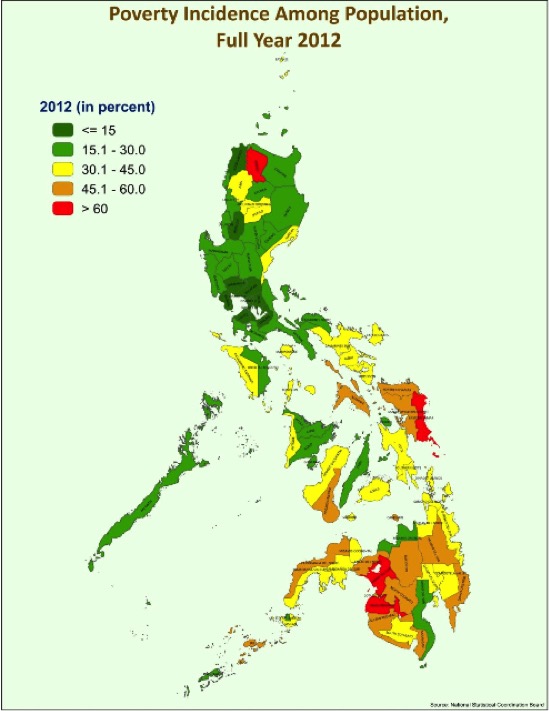
    The map above shows the poverty incidence in the country. This is the number of households living below the poverty threshold. As of 2017, it was 21.6%.[1]
    The poverty line for 2014 marked a per capita income of 100,534 pesos a year.[2] According to the data from the National Statistical Coordination Board, more than one-quarter of the population fell below the poverty linethe first semester of 2014, an approximate 78 percent increase since 2013.[3]
    The country’s poverty incidence for the whole of 2015 declined to 21.6 percent from 25.2 percent in 2012 and 26.3 percent in 2009, the Philippine Statistics Authority (PSA) reported.
    The decrease in poverty has been rapid and continuous, compared with broadly similar numbers in the 1980s,[4]such as People's Republic of China (PRC), Thailand, Indonesia or Vietnam. National Economic and Development Authority (NEDA) deputy director general Rosemarie Edillon attributed this to a generally low and stable inflation, improved incomes and higher employment rates during the period.[5]
    The government planned to eradicate poverty as stated in the Philippines Development Plan 2011-2016 (PDP). The PDP for those six years are an annual economic growth of 7-8% and the achievement of the Millennium Development Goals (MDGs). Under the MDGs, Philippines committed itself to halving extreme poverty from a level of 33.1% in 1991 to 16.6% by 2015.[4]

    Poverty statistics based on income and expenditures[edit]

    The Annual Poverty Indicator Survey, or APIS, is a survey held nationwide, administered by the National Statistics Office, World Bank Mission, and the United Nations Development Programme. It provides data on the different non-income indicators related to poverty and is held every year except for years when the Family Income and Expenditure Survey, or FIES, is being administered.[6] The survey provides data on the socio-economic profile and the living conditions of families in 78 provinces and all cities and municipalities of Metro Manila. The Family Income and Expenditure Survey, on the other hand, provides the same major and specified details of expenditures but over a larger sample area extending to provinces and municipalities across the Philippines.[7]

    Poverty and food threshold[edit]

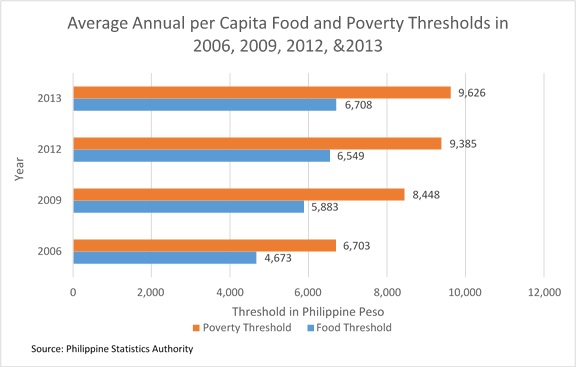
    The poverty threshold, also known as the poverty line, is the minimum income required to meet basic food needs and other non-food requirements such as clothing, housing, transportation, health, and education expenses.[8] The food threshold is the minimum income required to meet basic food needs and satisfy the nutritional requirements set by the Food and Nutrition Research Institute (FNRI) to ensure that one remains economically and socially productive.[8] Recent estimates for the poverty and food thresholds has been consistently increasing. The food threshold, being the estimate for minimum food expenditures, consistently comprises around 70% of the minimum income requirement or poverty threshold.


    Compiled average annual per capita poverty and food threshold in the Philippines based on the results of the Family Income and Expenditure Survey[2] released by the Philippine Statistics Authority. The survey covered 51,000 samples.

    Poverty incidence and subsistence[edit]

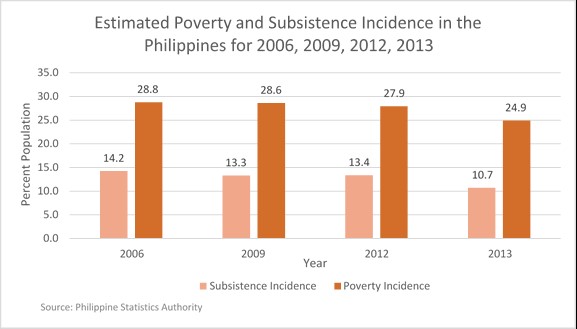
    Given the poverty thresholds mentioned above, poverty and subsistence incidences are computed by determining the proportion of the population and the families whose per capita income are below the poverty and food thresholds. Poverty incidence is the proportion of the population with per capita income less than the per capita poverty threshold.[8]Subsistence incidence, on the other hand, is the proportion of the population with per capita income less than the per capita food threshold.[8] Poverty and subsistence incidences for 2013 significantly decreased, indicating an improvement in the proportion of the population that are below the poverty line.


    Poverty and subsistence incidence based on the Family Income and Expenditure Survey (FIES) [7] and the Annual Poverty Indicator Survey (APIS).[6]
    2014 data released by Philippine Statistics Authority, however, estimated a 25.8% poverty incidence for the first semester (January to June 2014). This was an increase in poverty level from 2013. Subsistence incidence for the first semester of 2014, on the other hand, showed an improvement, with a 10.5% estimate.[2]

    Depth of poverty[edit]

    Income gap[edit]

    Income gap measures the average income required by the poor in order to get out of poverty (expressed relative to the poverty threshold).[8] Income gap is a measure of depth of poverty. In 2013, on average, families below the poverty line needed 27.4% the poverty threshold, or an additional monthly income of Php 2,638, to get out of poverty.[2] This was a slight decrease from 2012's income gap which requires an income of Php 2740 in order to overtake the poverty line
    I


    ncome gap in the Philippines for 2006, 2009, 2012, and 2013 based
    on the results from the Annual Poverty Indicator Survey

    Poverty gap[edit]

    Poverty gap is the total income shortfall (expressed relative to the poverty line) of families with income below the poverty threshold, divided by the total number of families. It is also a measure of depth of poverty. The poverty gap for the first semester of 2014 was 5.4%, a 0.2 unit increase from 2013, which was 5.2%.[2]
    Poverty gap in the Philippines for 2006, 2009, 2012, and 2013, 
    based on the Annual Poverty Indicator Survey
    According to the Asian Development Bank, in 2016 it was estimated that 60% of the Philippine population aged 15 years and above were employed.[9][not in citation given]

    GINI index[edit]

    Added ((main article|Gini coefficient}} The GINI index, also known as the GINI ratio or GINI coefficient, measures the degree of inequality in the distribution of family income in a country.[10] A GINI index of 0 represents perfect equality, while an index of 100 implies perfect inequality. For the Philippines, the GINI index is measured every three years during the Family Income and Expenditure Survey. In 2009, the GINI index was 46.41. It decreased 0.36 units to 46.05 in 2012. These indices were both higher than the average of 38.8.

    Other poverty-related statistics[edit]

    Rapid population growth[edit]

    In 1985, the absolute number of people living in poverty was 26.5 million. This increased to 30.4 million in 2000 and from 2006 to 2009, increased by almost 970,000 Filipinos from 22.2 million to 23.1 million.[4]
    As the Philippines has financially limited resources and a high poverty rate, the rapid increase in population has become a problem because there are insufficient resources to support the population, which leaves fewer resources to improve the economy. From 2003 to 2006, even though the Philippines experienced above-average economic growth, the poverty incidence increased as a result of its population growth rate.[11]

    Unemployment[edit]

    Poverty reduction has not kept up with GDP growth rates, largely due to the high unemployment rate, high inflation rate and wide income inequality. The official rate of unemployment for 2012 in the Philippines was 6.5 percent.[12]

    Labor Force Survey for 2014 and 2015

    Education and Literacy[edit]

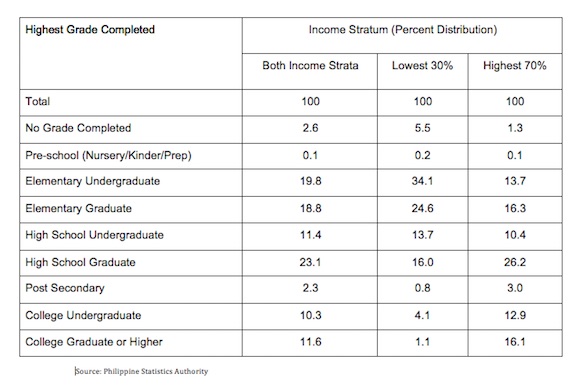
    There is a great contrast between the achievement of tertiary education by family heads belonging to the lowest 30% and the highest 70%. From the 3 to 24-year olds who attended school during the year 2010 to 2011, only 4% of those under the poverty line were in college, while 18% of the highest 70% were in college. From the data concerning 6 to 24-year olds from the lowest 30% who had not attended school during the year 2010 to 2011, the two highest reasons for not attending were "lack of personal interest" at 28.9% and "high cost of education" at 26.8%.[6]

    Families by Highest Grade Completed of the Family Head and by Income Stratum, Philippines 2011

    Human Development Index[edit]

    The Human Development Index, as defined by the United Nations, is a summary measure of average achievement in key dimensions of human development: a long and healthy life, being knowledgeable and having a decent standard of living. For the Philippines, the HDI increased by 16.5% between 1980 and 2013. The country ranked 117 out of 187 countries in 2013. The HDI in 2013 was 0.660, which implied that the Philippines was under the medium human development group (which needs an HDI of 0.614). The nation's HDI was higher than the average for countries in the medium human development group, but lower than the average of the countries in East Asia and Pacific (0.703).
    The Inequality Adjusted Human Development Index (IHDI) discounts each dimension's (health, education and income) average value according to its level of inequality. Inequality pulls down HDI by 18.1% in the Philippines, which makes the IHDI equal to 0.540. As in the HDI, the country's IHDI is higher than the average of medium human development group, which is 0.457, a 25.6% loss due to inequality. The IHDI value of the average in the countries of East Asia and Pacific was 0.564, which was still higher than the Philippines'.[3]

    Houses and lots[edit]

    Pieperkykooky.jpg
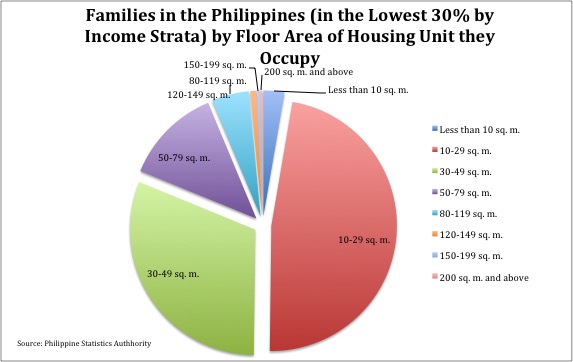
    It can be seen that 50.2% of families from the lowest 30% have floor areas below 30 square meters. From the data concerning the type of construction material of the roof of the building families occupy, 87.4% of the highest 70% had strong materials compared with the 62.8% of the lowest 30% and 6.3% of the highest 70% had light materials compared with the 27.3% of the lowest 30%.
    From the data concerning the type of construction material of the outer walls of the building families occupy, 78.3% of the highest 70% had strong materials compared with the 46.4% of the lowest 30% and 8.7% of the highest 70% had light materials compared with the 32.4% of the lowest 30%. From the data concerning the type of toilet facility families use, it was noticeable that 12.9% of the lowest 30% had no toilet, field, or bush.[6]
    Housingperkykooky.jpg
    Lalaperkykooky.jpg

    Hunger[edit]

    The gap between the percentage of families below the poverty line and those above the poverty line is noticeable. 14.5% of families belonging to the lowest 30% had experienced hunger in the three months preceding the survey, while only 2.8% of families belonging to the highest 70% had experienced hunger in the three months preceding the survey.[7]

    Electricity and access to resources[edit]

    Only 70.2% of families belonging to the lowest 30% have electricity in their homes, compared with the 94.5% of the families belonging to the highest 70%. It is also noticeable that 27.2% of families belonging to the lowest 30% have either a public tap, an unprotected well, or an undeveloped spring for their main source of water supply.[6]
    Resourcesperkykooky.jpg


    Poverty demographics[edit]

    National level[edit]

    In 2012, a family of five would need an average of P5,513 per month in order to meet their basic food needs, and a further P2,377 in order to meet their nonfood needs. This represents an average inflation of 4.1% per year from 2009 to 2012.[8]
    Statistically, the percentage of Filipinos that couldn't meet the basic food needs stood at 7.5%. The number of poor families remained steady at 1.61 Million. One in five families were estimated to be poor in 2012, or 4.2 million.
    Aside from previous indicators, other measures such as the income gap and poverty gap also exist in order to have enough data to properly design programs that will help poverty. The income gap measures the amount of income required by the poor in order to get out of poverty in relation to the poverty threshold. In 2012, it was estimated that the income gap was at 26.2%, which meant that, on average, a family of five would need an additional P2,067 in order to move out of poverty in 2012.
    A total of P124 billion would be needed by the national government as cash transfers to the poor families in order to totally eradicate poverty in the country.
    As of 2016, there were a total of 101.57 million Filipinos. 25.2% of the population lived below the national poverty line.[9]

    Natperkykooky.jpg

    Regional level[edit]

    At the regional level, NCR, CALABARZON and Central Luzon had the lowest poverty incidence in the country during 2006, 2009, and 2012. ARMM remained the poorest region with the highest poverty incidence, which ranged from 40 to 49% in 2006, 2009, and 2012.

    Provincial level[edit]

    At the provincial level, the group of provinces with the least poverty incidence are the four districts of NCR, Bataan, Benguet, Bulacan, Cavite, Laguna, Pampanga, Rizal, and Ilocos Norte. The group with the highest poverty are Eastern Samar, Lanao del Sur, Maguindanao, Masbate, Northern Samar, Sarangani, Zamboanga del Norte, Camiguin, Lanao del Norte, North Cotabato, and Western Samar.

    Summary[edit]

    In general, one out of every five families were poor in 2012. The ratio of poor families remained the same from 2006, but due to population increase, the number rose from 3.8 million in 2006 to 4.2 million in 2012. Furthermore, one out of 10 families couldn't meet their basic food needs. Nevertheless, the estimated number of poor families remained steady at around 1.6 million.
    The map above shows the poverty incidence in the country. This is the number of households living below the poverty threshold. It can be seen that the provinces of Apayao, Eastern Samar, Lanao del Sur, and Maguindanao have incidences higher than 60%. In Mindanao, apart from Lanao del Sur and Maguindanao, the rest of the region's provinces have indices that are 60% or lower. In Visayas, the western part contains most of the provinces with lower than 30% incidence, while the eastern part mostly has lower than 60% incidence. Luzon has the least number of provinces with higher than 30% incidence. This may be attributed to their relative ease of trade with the capital.

    See also[edit]

    References[edit]

    1. Jump up^ "Poverty in the Philippines"Asian Development Bank. Retrieved October 2, 2017.
    2. Jump up to:a b c d e "PSA- Poverty Statistics"www.nscb.gov.ph. Retrieved 2015-12-04.
    3. Jump up to:a b "PSA-Makati - Poverty Statistics"nap.psa.gov.ph. Retrieved 2015-12-04.
    4. Jump up to:a b c Philippines Development Plan 2011-2016 (Philippines 2011)
    5. Jump up^ http://www.philstar.com/headlines/2016/10/28/1638032/poverty-incidence-drops-21.6
    6. Jump up to:a b c d e "Annual Poverty Indicators Survey (APIS) - Philippine Statistics Authority"psa.gov.ph. Retrieved 2015-12-04.
    7. Jump up to:a b c "Family Income and Expenditure Survey (FIES) - Philippine Statistics Authority"psa.gov.ph. Retrieved 2015-12-04.
    8. Jump up to:a b c d e f "NSCB - Poverty Statistics"www.nscb.gov.ph. Retrieved 2015-12-04.
    9. Jump up to:a b "Poverty in the Philippines"Asian Development Bank. Archived from the original on 2016-11-21.
    10. Jump up^ "GINI index (World Bank estimate) | Data | Table"data.worldbank.org. Retrieved 2015-12-04.
    11. Jump up^ Philipinas Natin, In Pursuit of Inclusive Growth.
    12. Jump up^ "Philippine job growth lowest in ASEAN-5". Investvine.com. 2013-02-11. Retrieved 2013-03-15.